What actually kills people, decade by decade?
On this page
Heart disease and cancer killed about 1.3 million Americans in 2024, more than the next eight causes put together. The order changes with age. From 25 to 44, accidents come first. From 45 to 64 it’s cancer, then heart disease. From 65 on, heart disease leads, with cancer, stroke, lung disease and Alzheimer’s behind it.
Most of us worry about the causes we hear about. The list is mostly slow diseases that build for 20 or 30 years before anyone notices, which is good news in one way, since the same few habits push back on most of them.
What we’d do
Look at your own decade and the next one. Under 45, the risks are mostly accidents, so slow down on the road and treat drugs and heavy drinking as the real danger they are. From 45 on, work on the habits that protect your heart and arteries, because they cover the top causes at once. Don’t smoke, get fit, and know your blood pressure. After 65, add strength and balance, since falls become a cause of their own.
If you remember three things
- Two causes dominate. Heart disease (683,491 deaths) and cancer (619,876) were the top two in 2024.
- Young adults die mostly from accidents. They were 38.4% of deaths at 25 to 44 in 2023.
- The same habits cover most of the list. In the Harvard cohorts, if the links were causal, missing five healthy habits accounted for about 61% of all deaths and 72% of deaths from heart and blood vessel disease.
What were the leading causes of death in 2024?
Deaths from the ten leading causes. Heart disease and cancer alone killed more than the next eight together.
- Heart disease 683,491
- Cancer 619,876
- Accidents 197,449
- Stroke 166,852
- Chronic lung disease 145,643
- Alzheimer's disease 116,022
- Diabetes 94,445
- Kidney disease 55,081
- Liver disease 52,274
- Suicide 48,824
Suicide replaced COVID-19 as the tenth cause in 2024. If you’re thinking about suicide, call or text 988, the Suicide and Crisis Lifeline, any time.
How does it change decade by decade?
The CDC’s breakdown by age comes out later than the main list, so these are for 2023, the newest year with ages. Each share is the part of all deaths in that age group.
The top four causes in each age group, as a share of all deaths at those ages, 2023.
25 to 44
- Accidents38.4%
- Suicide9.8%
- Heart disease8.7%
- Cancer8.6%
45 to 64
- Cancer24.8%
- Heart disease20.3%
- Accidents11.8%
- Liver disease4.3%
65 and over
- Heart disease24.0%
- Cancer20.0%
- Stroke6.1%
- Chronic lung disease5.4%
85 and over
- Heart disease27.5%
- Cancer11.6%
- Alzheimer's disease7.7%
- Stroke7.5%
What moves each age group most:
- 25 to 44. Safety on the road, drugs and alcohol, and getting help early.
- 45 to 64. Not smoking, getting fit, and blood pressure.
- 65 and over. Blood pressure, fitness, strength and balance.
- 85 and over. Strength, balance and walking.
Accidents in the national figures mostly aren’t car crashes. Accidental poisoning, which includes drug overdoses, has been the leading way Americans die from injuries since 2011. In 2022, poisonings killed 112,728 people, falls 47,984 and traffic crashes 44,534.
What are the biggest preventable risks?
Causes of death are what goes on the certificate. Risks are what led there, and they’re where prevention starts. In 2009, a Harvard team worked out how many US deaths in 2005 could be tied to each of a dozen risks you can change. Smoking came first, at 467,000, and high blood pressure close behind at 395,000. Then overweight, not moving enough and high blood sugar, at around 200,000 each.
US deaths in 2005 tied to each risk, in thousands. One death can count under several risks, so they're never added up.
- SmokingWhat quitting gives back 467,000
- High blood pressurebloodpressure.guide 395,000
- Overweight and obesitybodyfat.guide 216,000
- Not moving enoughexercise.guide 191,000
- High blood sugarglucose.guide 190,000
- High LDL cholesterolcholesterol.guide 113,000
- Too much saltbloodpressure.guide 102,000
- Too little omega-3 fatfats.guide 84,000
- Trans fatfats.guide 82,000
- Alcohol (net)alcohol.guide 64,000
- Too few fruits and vegetablesmeals.guide 58,000
The numbers overlap, since one death can count under several risks (a smoker with high blood pressure, say), so they’re never added up. The order still holds in newer work. In the Global Burden of Disease study of 2021, the top risks behind US deaths were high blood pressure, high blood sugar, tobacco, diet and a high BMI, in that order. Each bar above links to the guide that covers what lowers it.
A picture from daily life
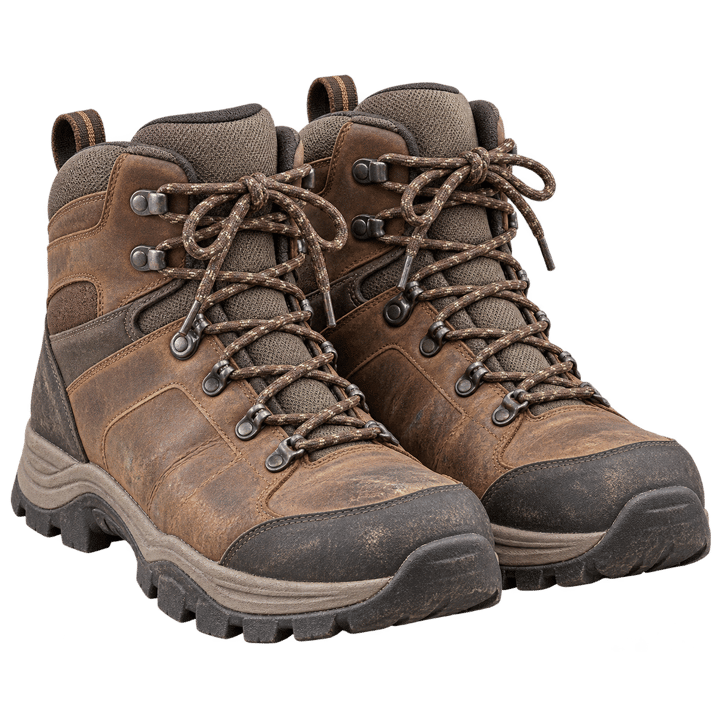
Think of a long hike. In the first miles the danger is crossing the road to the trailhead. In the middle it’s the long climb, where your heart and lungs do the work. Near the end it’s the loose rocks on the way down, where one slip can end the trip. The hazards change as you go, and so does what keeps you safe.
Which habit moves which cause?
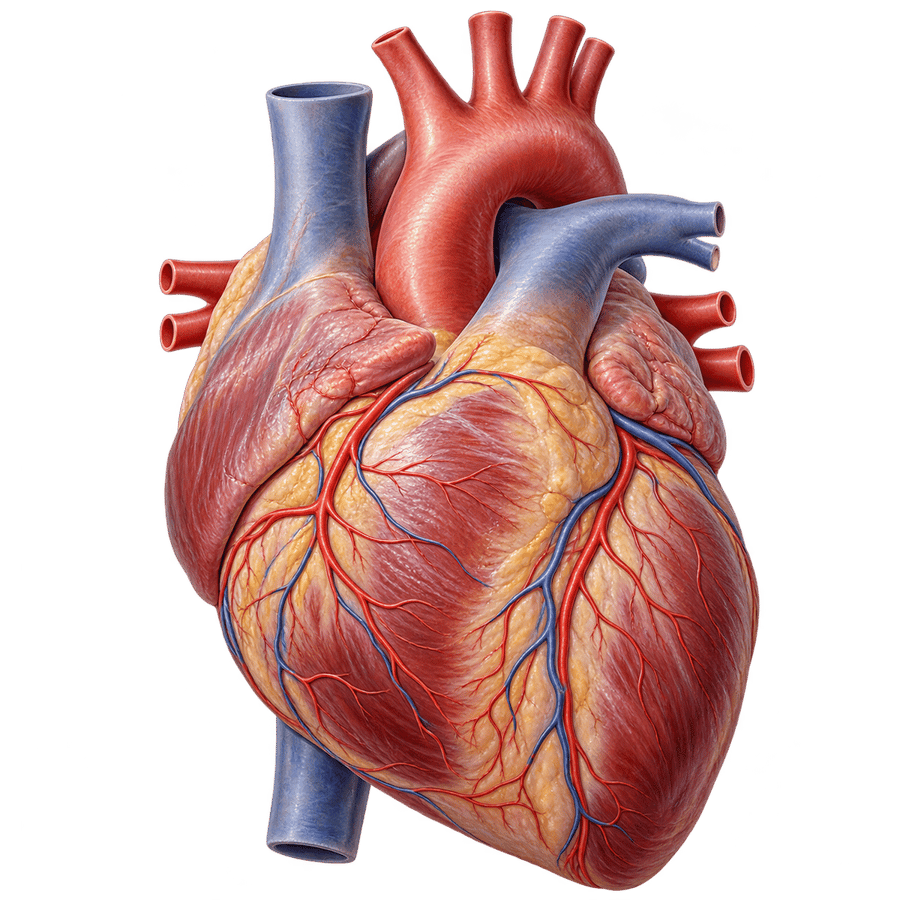
- Blood pressure, for heart disease and stroke. In a million adults, each 20 points (mmHg) higher systolic (the top number) at 40 to 69 went with more than twice the death rate from stroke and twice the rate from coronary heart disease, all the way down to 115/75. Know your number.
- Fitness, for heart disease. In 122,007 treadmill tests, being in the bottom quarter for fitness carried as much risk as smoking or diabetes, or more.
- Not smoking, for cancer and lung disease. Most of the extra deaths among US smokers came from cancers, blood vessel and lung diseases that smoking can cause. Smokers lost more than 10 years. What quitting gives back.
- Moving and lifting, for Alzheimer’s. In 147,374 US adults, 90 to 119 minutes a week of strength training went with a 27% lower death rate from diseases of the brain and nerves. In a 2025 review of step studies, the risk of dementia fell with more steps, with most of the drop by 5,000 to 7,000 a day.
- Balance and leg strength, for falls. More than 1 in 4 older Americans fall each year. People aged 51 to 75 who couldn’t stand on one leg for 10 seconds had an 84% higher risk of dying over 7 years. How do you keep your healthy years?
How much of this is preventable?
It’s more than most people guess. In the Harvard study of 123,219 health professionals, the researchers worked out how many deaths were tied to not having five habits (not smoking, a healthy weight, 30 minutes a day of activity, a good diet and moderate drinking). If the links were causal, missing them accounted for 60.7% of all deaths, 71.7% of deaths from heart and blood vessel disease, and 51.7% of cancer deaths.
These were nurses and other health professionals, so the shares could be different in other groups. And if part of the link comes from healthy people doing healthy things, the true shares are smaller.
Don’t you have to die of something?
The sceptic says
Prevent heart disease and you’ll die of cancer instead. Everyone dies, so all you do is swap one cause for another, and maybe spend longer frail at the end.
The reply
You swap it later, and you’re healthier on the way. In the same Harvard cohorts, women with four or five of the habits at 50 lived 34.4 years free of diabetes, heart disease and cancer, against 23.7 for women with none. For men it was 31.1 and 23.5. They lived longer, and a bigger share of their years was disease free, 83.6% against 74.8% for the women.
Your turn
See your own estimate, with the habit costing you the most years, or look up how long people your age live.
16 sources
- National Center for Health Statistics, Mortality in the United States, 2024, Data Brief 548cdc.gov
- Tejada-Vera B and others, Deaths: Leading Causes for 2023, National Vital Statistics Reports 74(10), 2025cdc.gov
- Xu J and others, Deaths: Final Data for 2022, National Vital Statistics Reports 74(4), 2025cdc.gov
- Li Y and others, Impact of Healthy Lifestyle Factors on Life Expectancies in the US Population, Circulation, 2018pmc.ncbi.nlm.nih.gov
- Li Y and others, Healthy lifestyle and life expectancy free of cancer, cardiovascular disease, and type 2 diabetes: prospective cohort study, BMJ, 2020pmc.ncbi.nlm.nih.gov
- Jha P and others, 21st-century hazards of smoking and benefits of cessation in the United States, New England Journal of Medicine, 2013pubmed.ncbi.nlm.nih.gov
- Lewington S and others, Age-specific relevance of usual blood pressure to vascular mortality: a meta-analysis of individual data for one million adults in 61 prospective studies, Lancet, 2002pubmed.ncbi.nlm.nih.gov
- Mandsager K and others, Association of Cardiorespiratory Fitness With Long-term Mortality Among Adults Undergoing Exercise Treadmill Testing, JAMA Network Open, 2018jamanetwork.com
- Zhang Y and others, Long-term resistance training with all-cause and cause-specific mortality, British Journal of Sports Medicine, 2026pubmed.ncbi.nlm.nih.gov
- Ding D and others, Daily steps and health outcomes in adults: a systematic review and dose-response meta-analysis, Lancet Public Health, 2025pubmed.ncbi.nlm.nih.gov
- Centers for Disease Control and Prevention, Older Adult Falls Datacdc.gov
- Araujo CG and others, Successful 10-second one-legged stance performance predicts survival in middle-aged and older individuals, British Journal of Sports Medicine, 2022pubmed.ncbi.nlm.nih.gov
- Danaei G and others, The preventable causes of death in the United States: comparative risk assessment of dietary, lifestyle, and metabolic risk factors, PLoS Medicine, 2009pmc.ncbi.nlm.nih.gov
- GBD US Health Disparities Collaborators, burden of disease and risk factors in US states, 1990 to 2021, Lancet, 2024pmc.ncbi.nlm.nih.gov
- US Burden of Disease Collaborators, The State of US Health, 1990-2016, JAMA, 2018pmc.ncbi.nlm.nih.gov
- 988 Suicide and Crisis Lifeline988lifeline.org